Test a strategy with AI: describe it in plain words
Test with AI turns a strategy written in plain words into a plan made only of things the app can do, then runs that plan day by day on the real historical option prices. Here is one run from start to finish: a put credit spread on SPX, opened again and again from January to March 2023.
1. Start a test, then press Test with AI
Start a test on the first day you want, as for any backtest. This example starts on Tuesday 3 January 2023 with $100,000. Then press Test with AI in the top bar. The window opens with the test day as the start; pick the end date (here 31 March 2023) and describe the strategy in your own words:
Sell a put credit spread on SPX, 30 delta, about 30 days out. Close it at 50% profit or at 21 days to expiry, then open a new one.
2. Read the plan before anything runs
Press Make the plan. The app shows what it understood, in plain words, and nothing has traded yet:
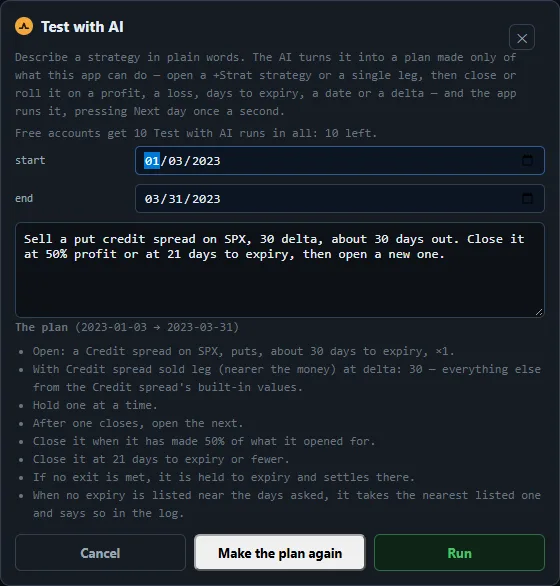
- Open: a Credit spread on SPX, puts, about 30 days to expiry, one at a time.
- The sold put at 30 delta, as asked. Everything not named, such as how far below it the bought put sits, comes from the Credit spread's built-in values (the bought put near 20 delta).
- Close when it has made 50% of what it opened for, or at 21 days to expiry, whichever comes first. After one closes, open the next.
If what you typed is not something the app can do, the window says so instead of guessing. Free accounts get 10 Test with AI runs; making the plan does not use one, pressing Run does.
3. Press Run and watch it play out
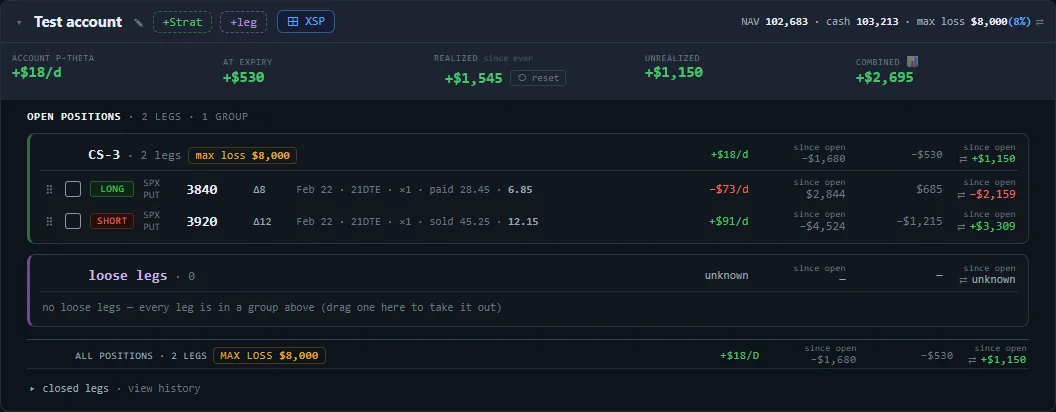
Run closes the window and presses Next day for you, once a second. Pause, Resume and Stop sit beside Next day. While it is paused, everything on the page is that day's real numbers, and you can look at any of it:
4. What the run did
Over 62 trading days the plan opened nine spreads, each about 30 days out with the sold put near 30 delta. Each row below is one spread, with the prices it actually filled at:
| Spread | Opened | Puts (sold / bought) | Credit | Closed | Why | P&L |
|---|---|---|---|---|---|---|
| CS-1 | 3 Jan | 3,710 / 3,625 | 20.15 | 10 Jan | 50% made | +$1,105 |
| CS-2 | 11 Jan | 3,855 / 3,775 | 18.60 | 20 Jan | 21 days left | +$440 |
| CS-3 | 23 Jan | 3,920 / 3,840 | 16.80 | 1 Feb | 50% made | +$1,140 |
| CS-4 | 2 Feb | 4,065 / 3,990 | 13.90 | 10 Feb | 21 days left | −$930 |
| CS-5 | 13 Feb | 4,025 / 3,925 | 19.75 | 22 Feb | 21 days left | −$2,155 |
| CS-6 | 23 Feb | 3,910 / 3,820 | 18.85 | 3 Mar | 21 days left | +$485 |
| CS-7 | 6 Mar | 3,950 / 3,875 | 15.10 | 15 Mar | 21 days left | −$2,030 |
| CS-8 | 16 Mar | 3,850 / 3,750 | 19.10 | 24 Mar | 21 days left | +$190 |
| CS-9 | 27 Mar | 3,880 / 3,800 | 15.95 | 31 Mar | 50% made | +$935 |
Added up, the nine spreads lost $820; with commissions the account ended the run at $99,140.22. SPX started at 3,820.86 and was at 4,105.54 on the last day, so the market rose over the three months, yet two sharp dips (to 3,981.59 on 22 February and 3,891.08 on 15 March) fell on the days two spreads had to close at 21 days to expiry. Those two losses and CS-4's together outweighed the six winners.
What this example shows
- The plan does exactly what its words say, every day, with no hesitation. That is the point of writing a rule down, and also its risk: "close at 21 days" closed CS-5 and CS-7 at their worst days.
- A 50% target is checked once a day on the closing prices, so a spread can pass it by more than the target (CS-3 made about two thirds of its credit before the day it was checked).
- One run is one stretch of dates. Run the same words over another stretch, or step through CS-5's days by hand and decide for yourself, and compare.
This example is one real run of Test with AI in Test My Legs on the recorded SPX option prices of January to March 2023. It is a backtest: it shows what happened on those days, not what will happen next.
Try it on another date yourself. Test My Legs is free: pick a past day and step through it.
Start now